A gene is a stretch of DNA that carries the instructions for building complex molecules in an organism. The activity level of a gene (the gene “expression”) and its role in shaping the development of plants and their adaptation to the environment is widely studied. However, differences in gene expression across different plants of the same species that are genetically identical, and in the same environment, have been observed – and expressions also change over time in the same plant. Understanding why certain genes exhibit high expression variability (“highly variable genes” or HVGs) is a longstanding challenge in plant genomics.
In partnership with Dr Sandra Cortijo from the Institute for Plant Sciences of Montpellier (IPSiM), we worked with multiple datasets to better understand what makes a gene highly variable. Discovery Engine, our data-first scientific knowledge discovery platform, automatically identified both well-known and novel patterns relating to gene variability – helping us to understand mechanisms that govern gene expression plasticity.
We combined ten datasets from Dr Cortijo’s previous research, which contained the following variables [1,2,3]:
- bio_var: the maximum gene variability throughout the day, measured between plants at a given time point.
- evo_Ka_Ks_ratio: the evolutionary rate of the gene, calculated as the Ka/Ks ratio.
- dap_TF_count: the number of transcription factors binding to a given gene.
- Chromatin_sum_open: the sum of selected chromatin marks with open states for a given gene.
- Chromatin_sum_closed: the sum of selected chromatin marks with closed states for a given gene.
- half_life: The half life of the mRNA for the gene (in hours).
- entropy: the Shannon entropy value, based on expression data in different tissues of plants.
- introns: the total number of introns that the gene has.
- size: the length of the gene.
Why this matters
Better understanding this phenomenon is extremely important, as it can have both positive and negative consequences. Gene variability could allow populations of plants to survive high stress and unexpected environmental changes, as has been shown in unicellular organisms [4] – but given the high level of mechanization used in modern agriculture, there are also benefits to reducing variability for the sake of more reliable and predictable outcomes. Understanding and modulating variability can therefore directly inform climate‑smart agriculture strategies – specifically, the precise breeding or engineering of crops with enhanced resilience to stress and improved yields.
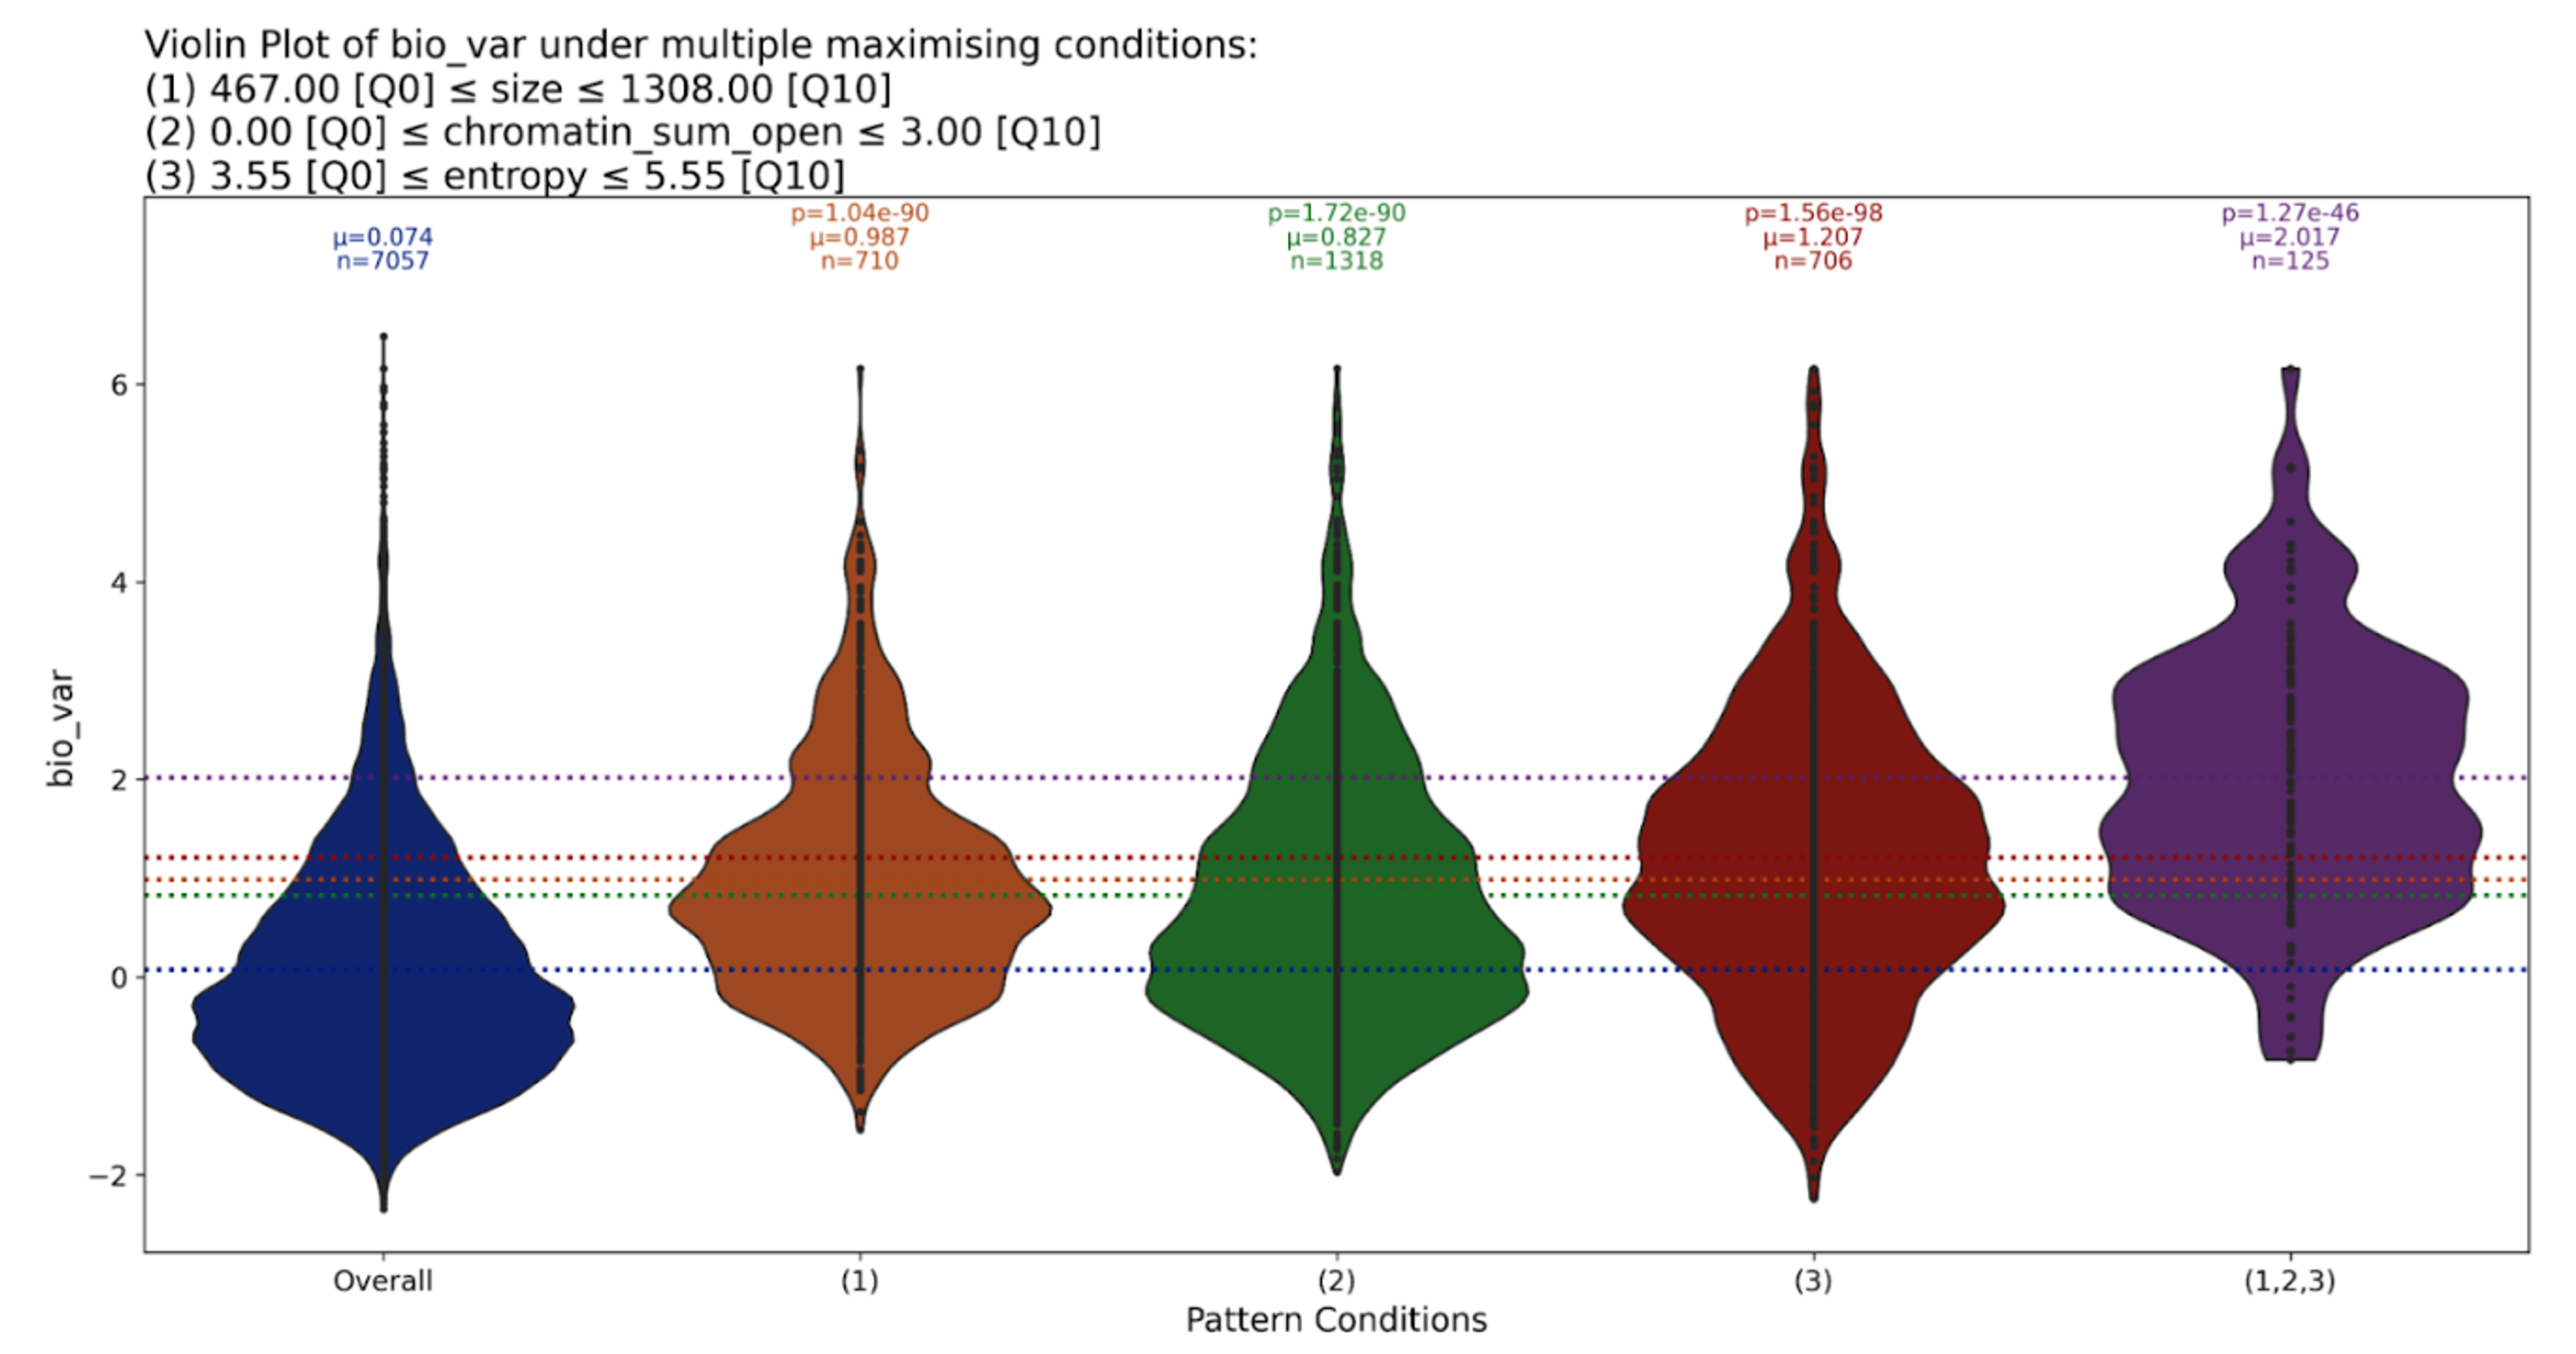
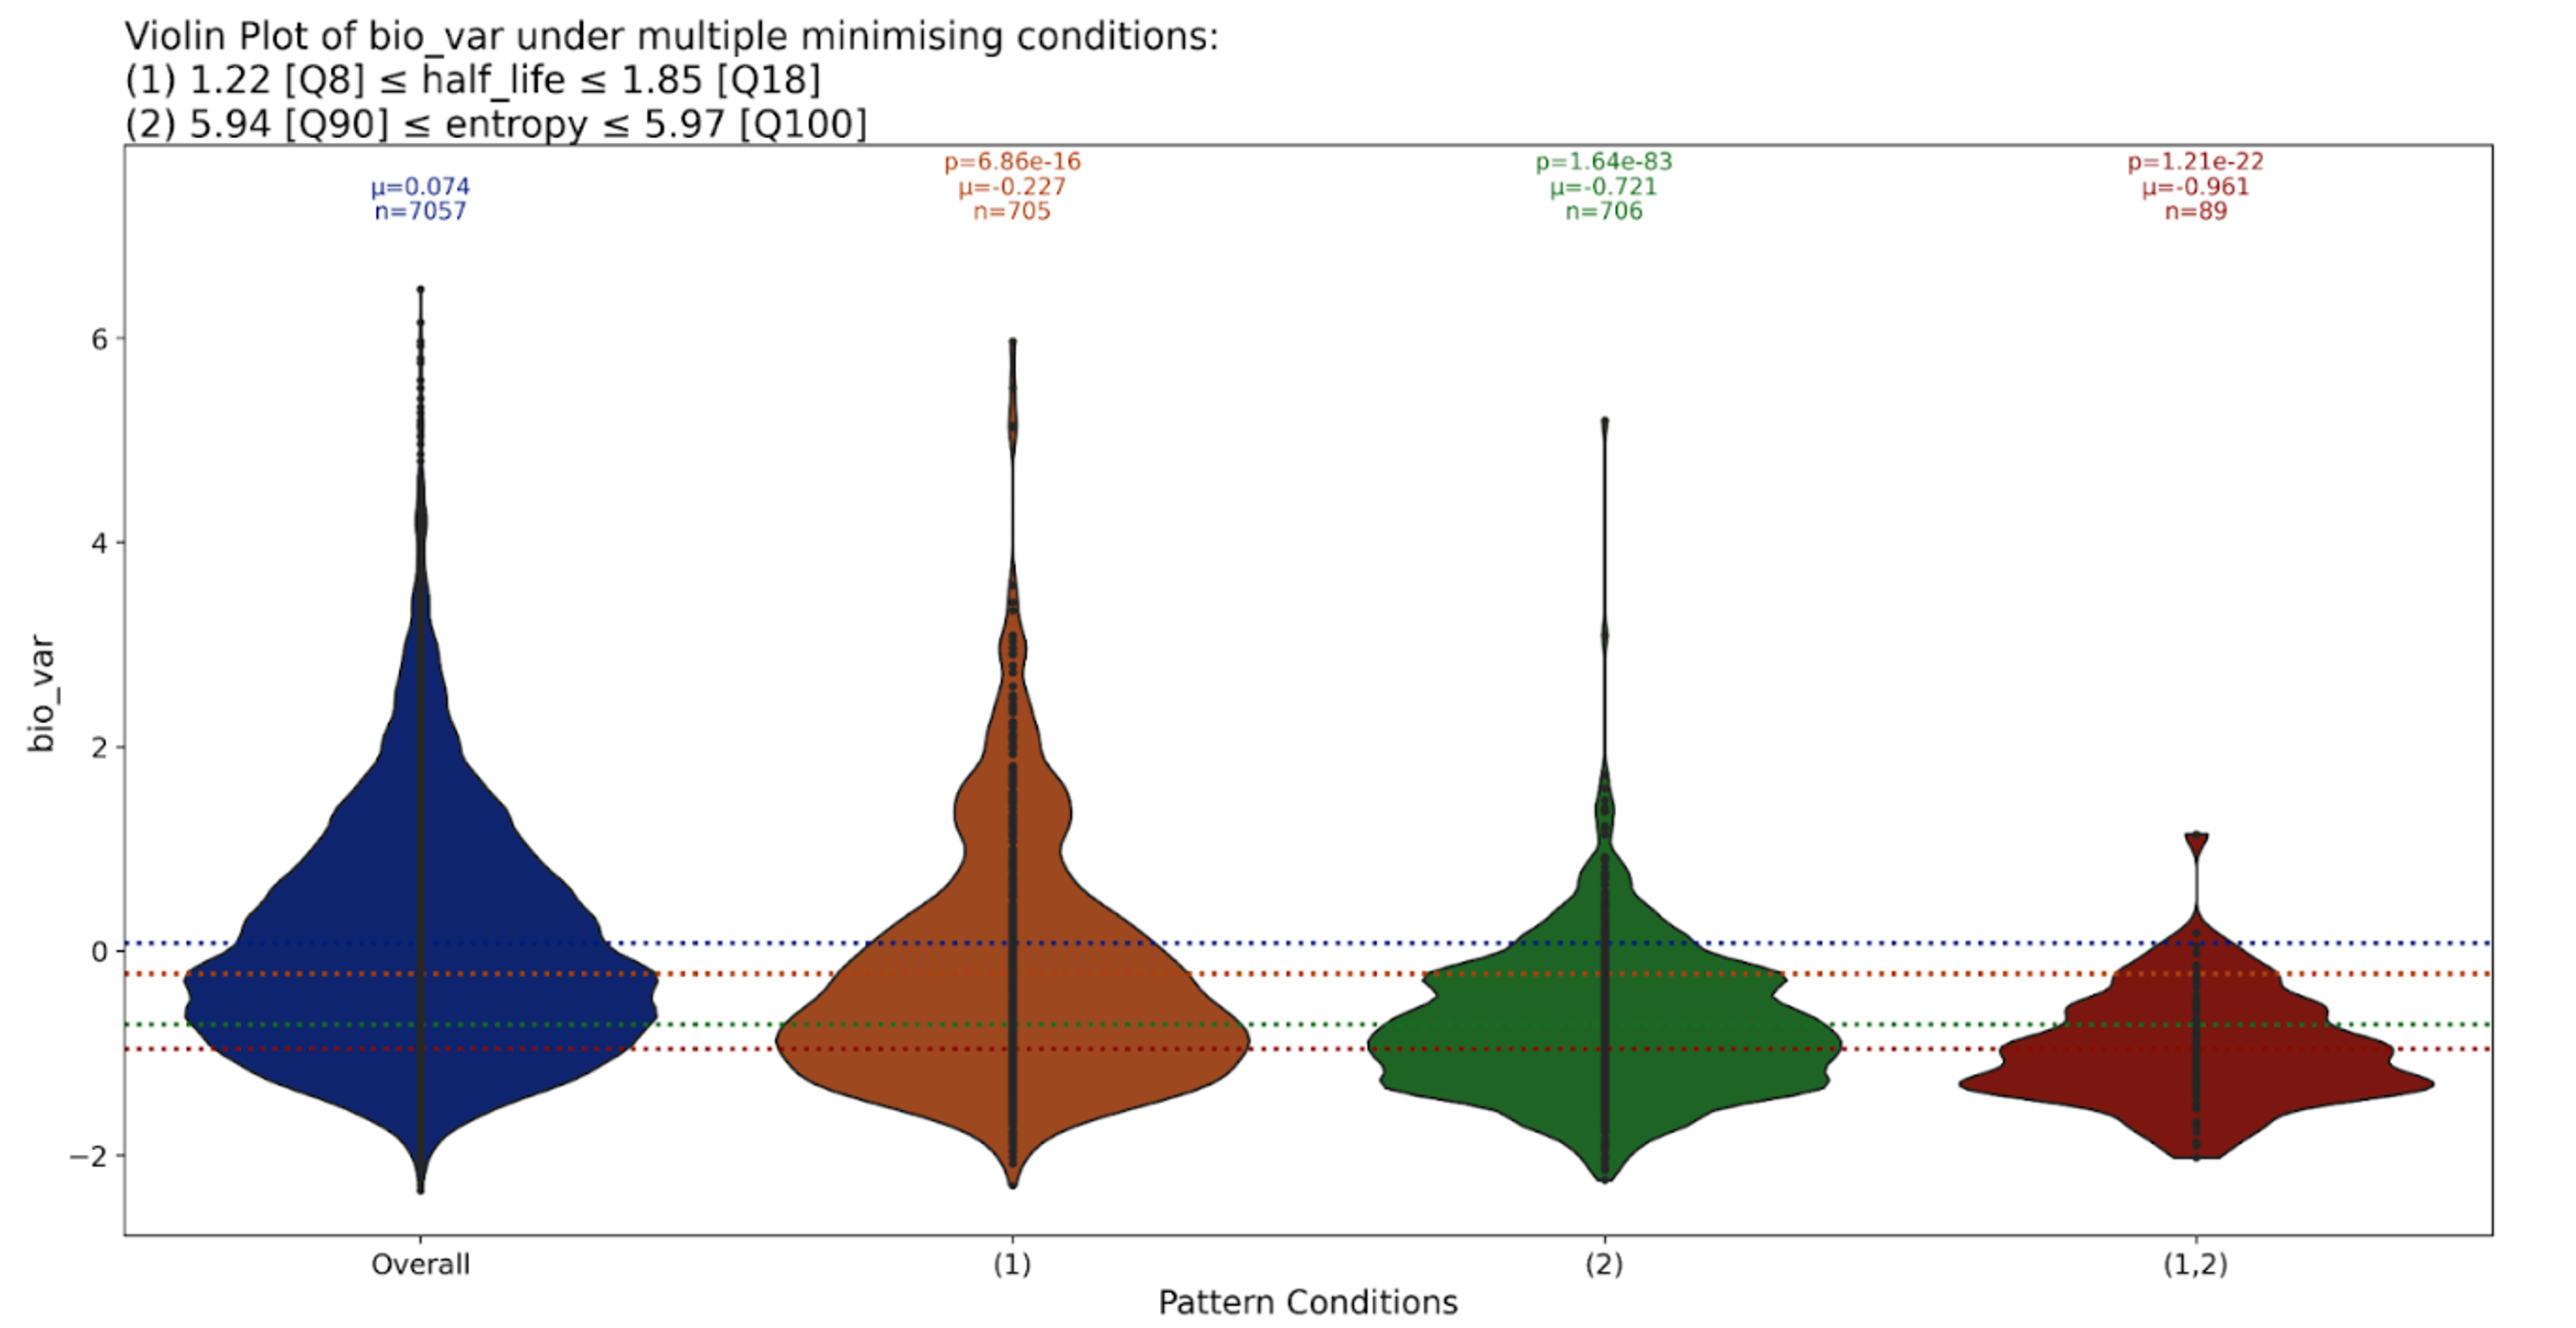
Discovery Engine identified 67 patterns in this data. We have selected some of the more interesting ones to discuss here. The variable we are most interested in is bio_var – a measure of the level of variability for a gene, relative to all other genes, and independent of its expression level [1].One way of visualising these patterns is as violin plots. Each violin represents the distribution of bio_var, shown on the y axis, under different sets of conditions (or rules) extracted by our system, shown on the x axis. Above each violin, we show the p-value (p), the mean of the target value (μ) in the data subset defined by each condition (also denoted by a horizontal dotted line), and the number of samples (n) in that subset.
The violin on the far left is always the distribution of bio_var over the entire dataset, and the plot on the far right is always the distribution of bio_var under the combination of all conditions in the pattern.
Combined effects of short gene length, low shannon entropy and minimal open chromatin marks
Discovery Engine found that when short gene length, low Shannon entropy, and minimal open chromatin marks appear together, gene variability was significantly increased. It is established in existing literature that each of these factors increase gene variability individually [1], but they have never previously been studied in combination. Combining them increases variability far more than when any appears alone – but this relationship is not simply additive.
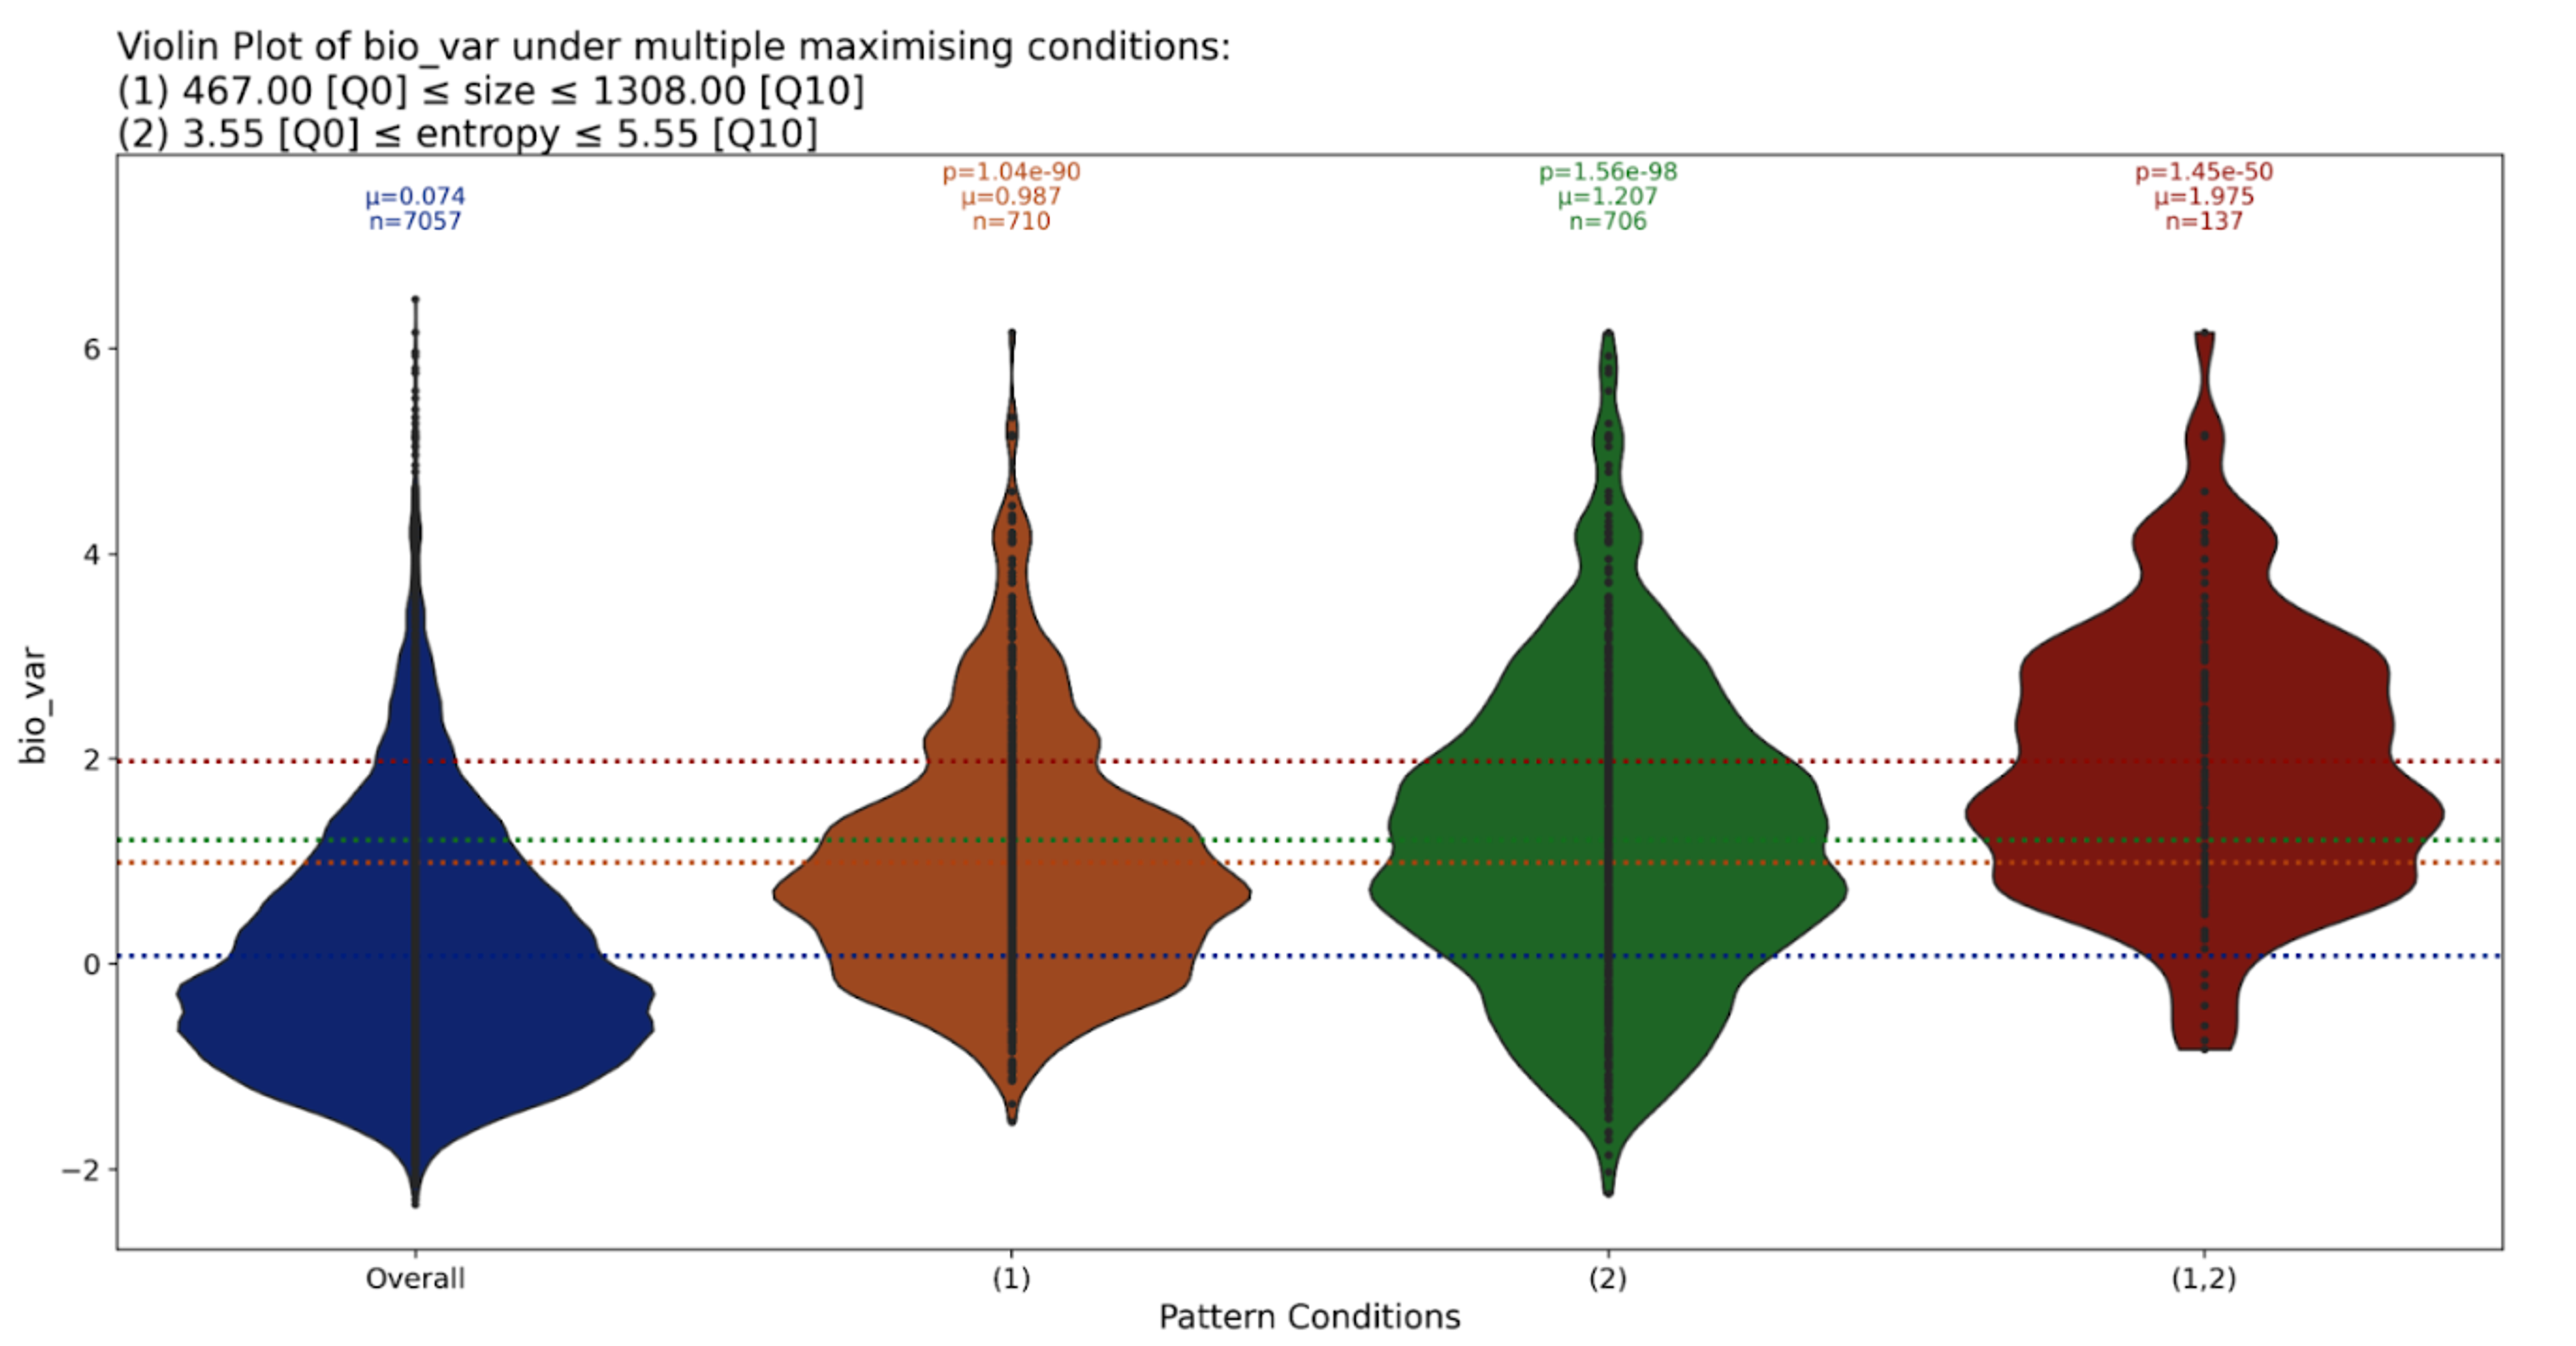
Discovery Engine allows us to dig deeper. We can also see how the variability increase is attributed to each pair of these three features – allowing us to understand which combination of features has the most impact. Below we see the two most significant features for increasing gene variability: size and entropy. These together account for almost all of the observed variability, and appear to be approximately additive in terms of their effect on gene variability. So we can see that while low chromatin_sum_open is predictive of high variability in general, when combined with low gene size and low entropy, its effect is actually minimal. Some interesting non-linearity here – and these are the kinds of patterns that are really hard to find manually, unless you know what you’re looking for.
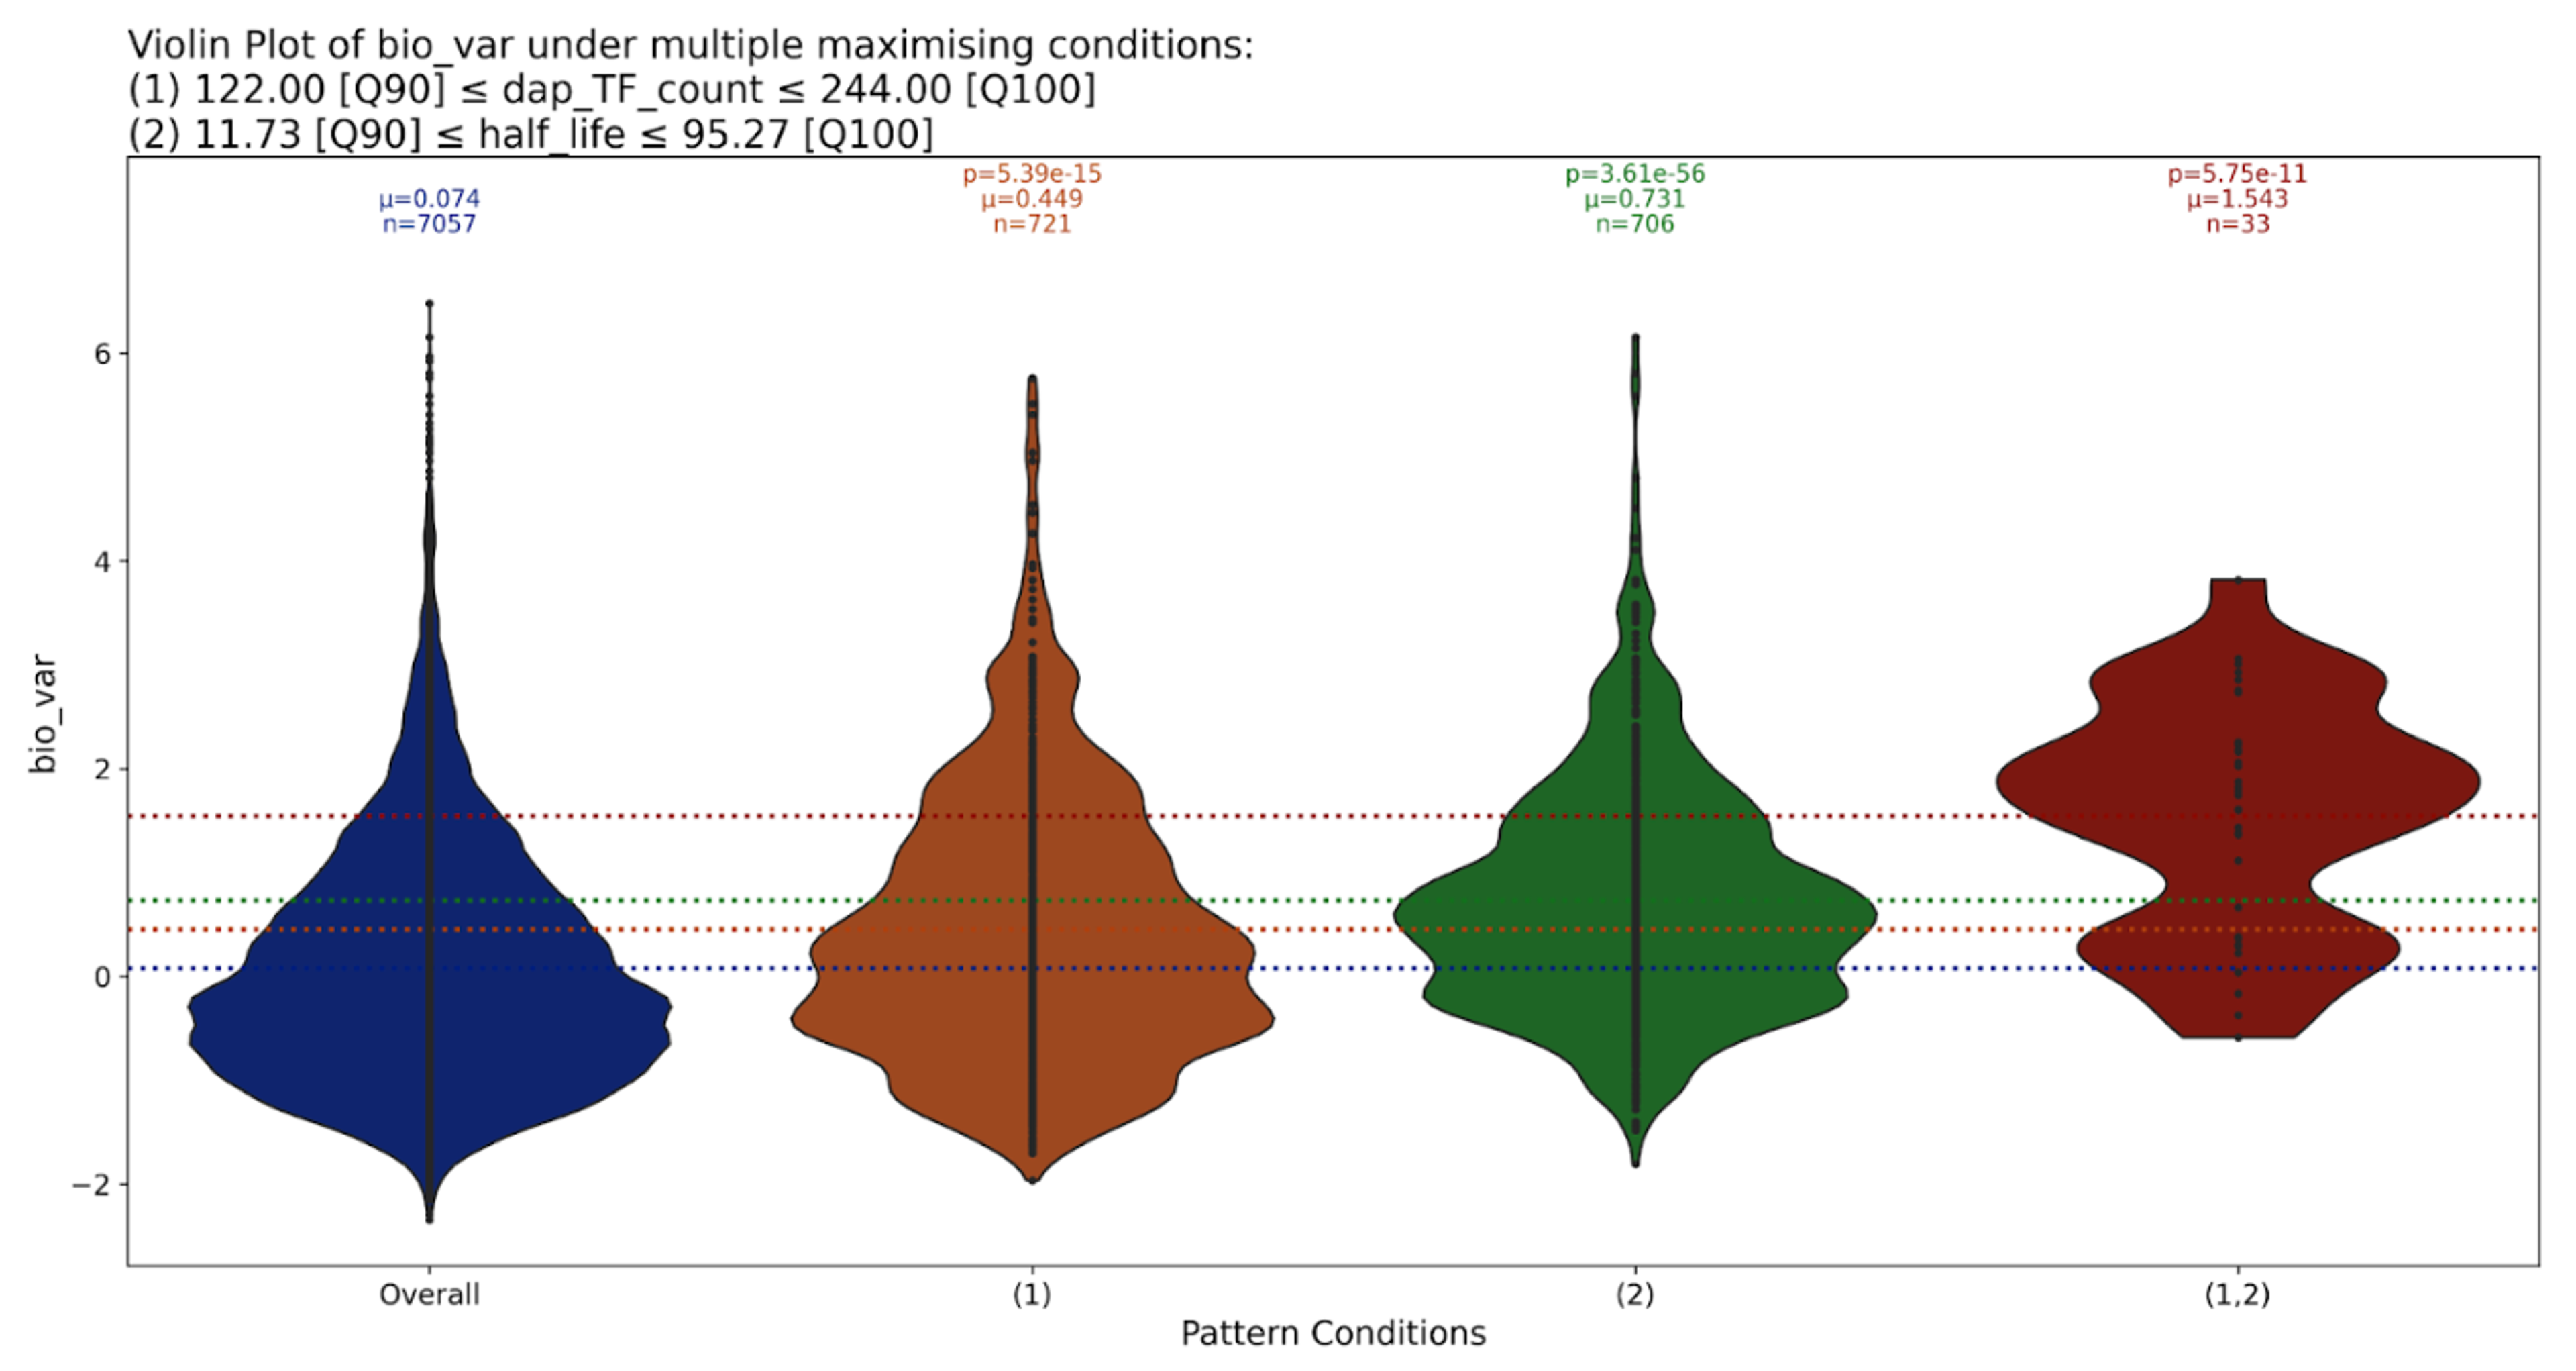
A high number of transcription factors that bind to a gene (dap_TF_count) has also been reported to correlate with its variability [1]. These results were confirmed independently by Discovery Engine, as shown below. But, it also found that combining dap_TF_count with high half life further increased gene variability, far more than either variable alone.
Understanding mRNA half life as a predictor of gene expression variability
In 25 of the 67 total patterns, Disco found the gene’s mRNA half-life to be a key predictor of HVGs. Here we show one example of this, where an extremely long half-life (in the top 10% of the values in the data) is combined with low entropy and open chromatin marks, to significantly increase gene variability.
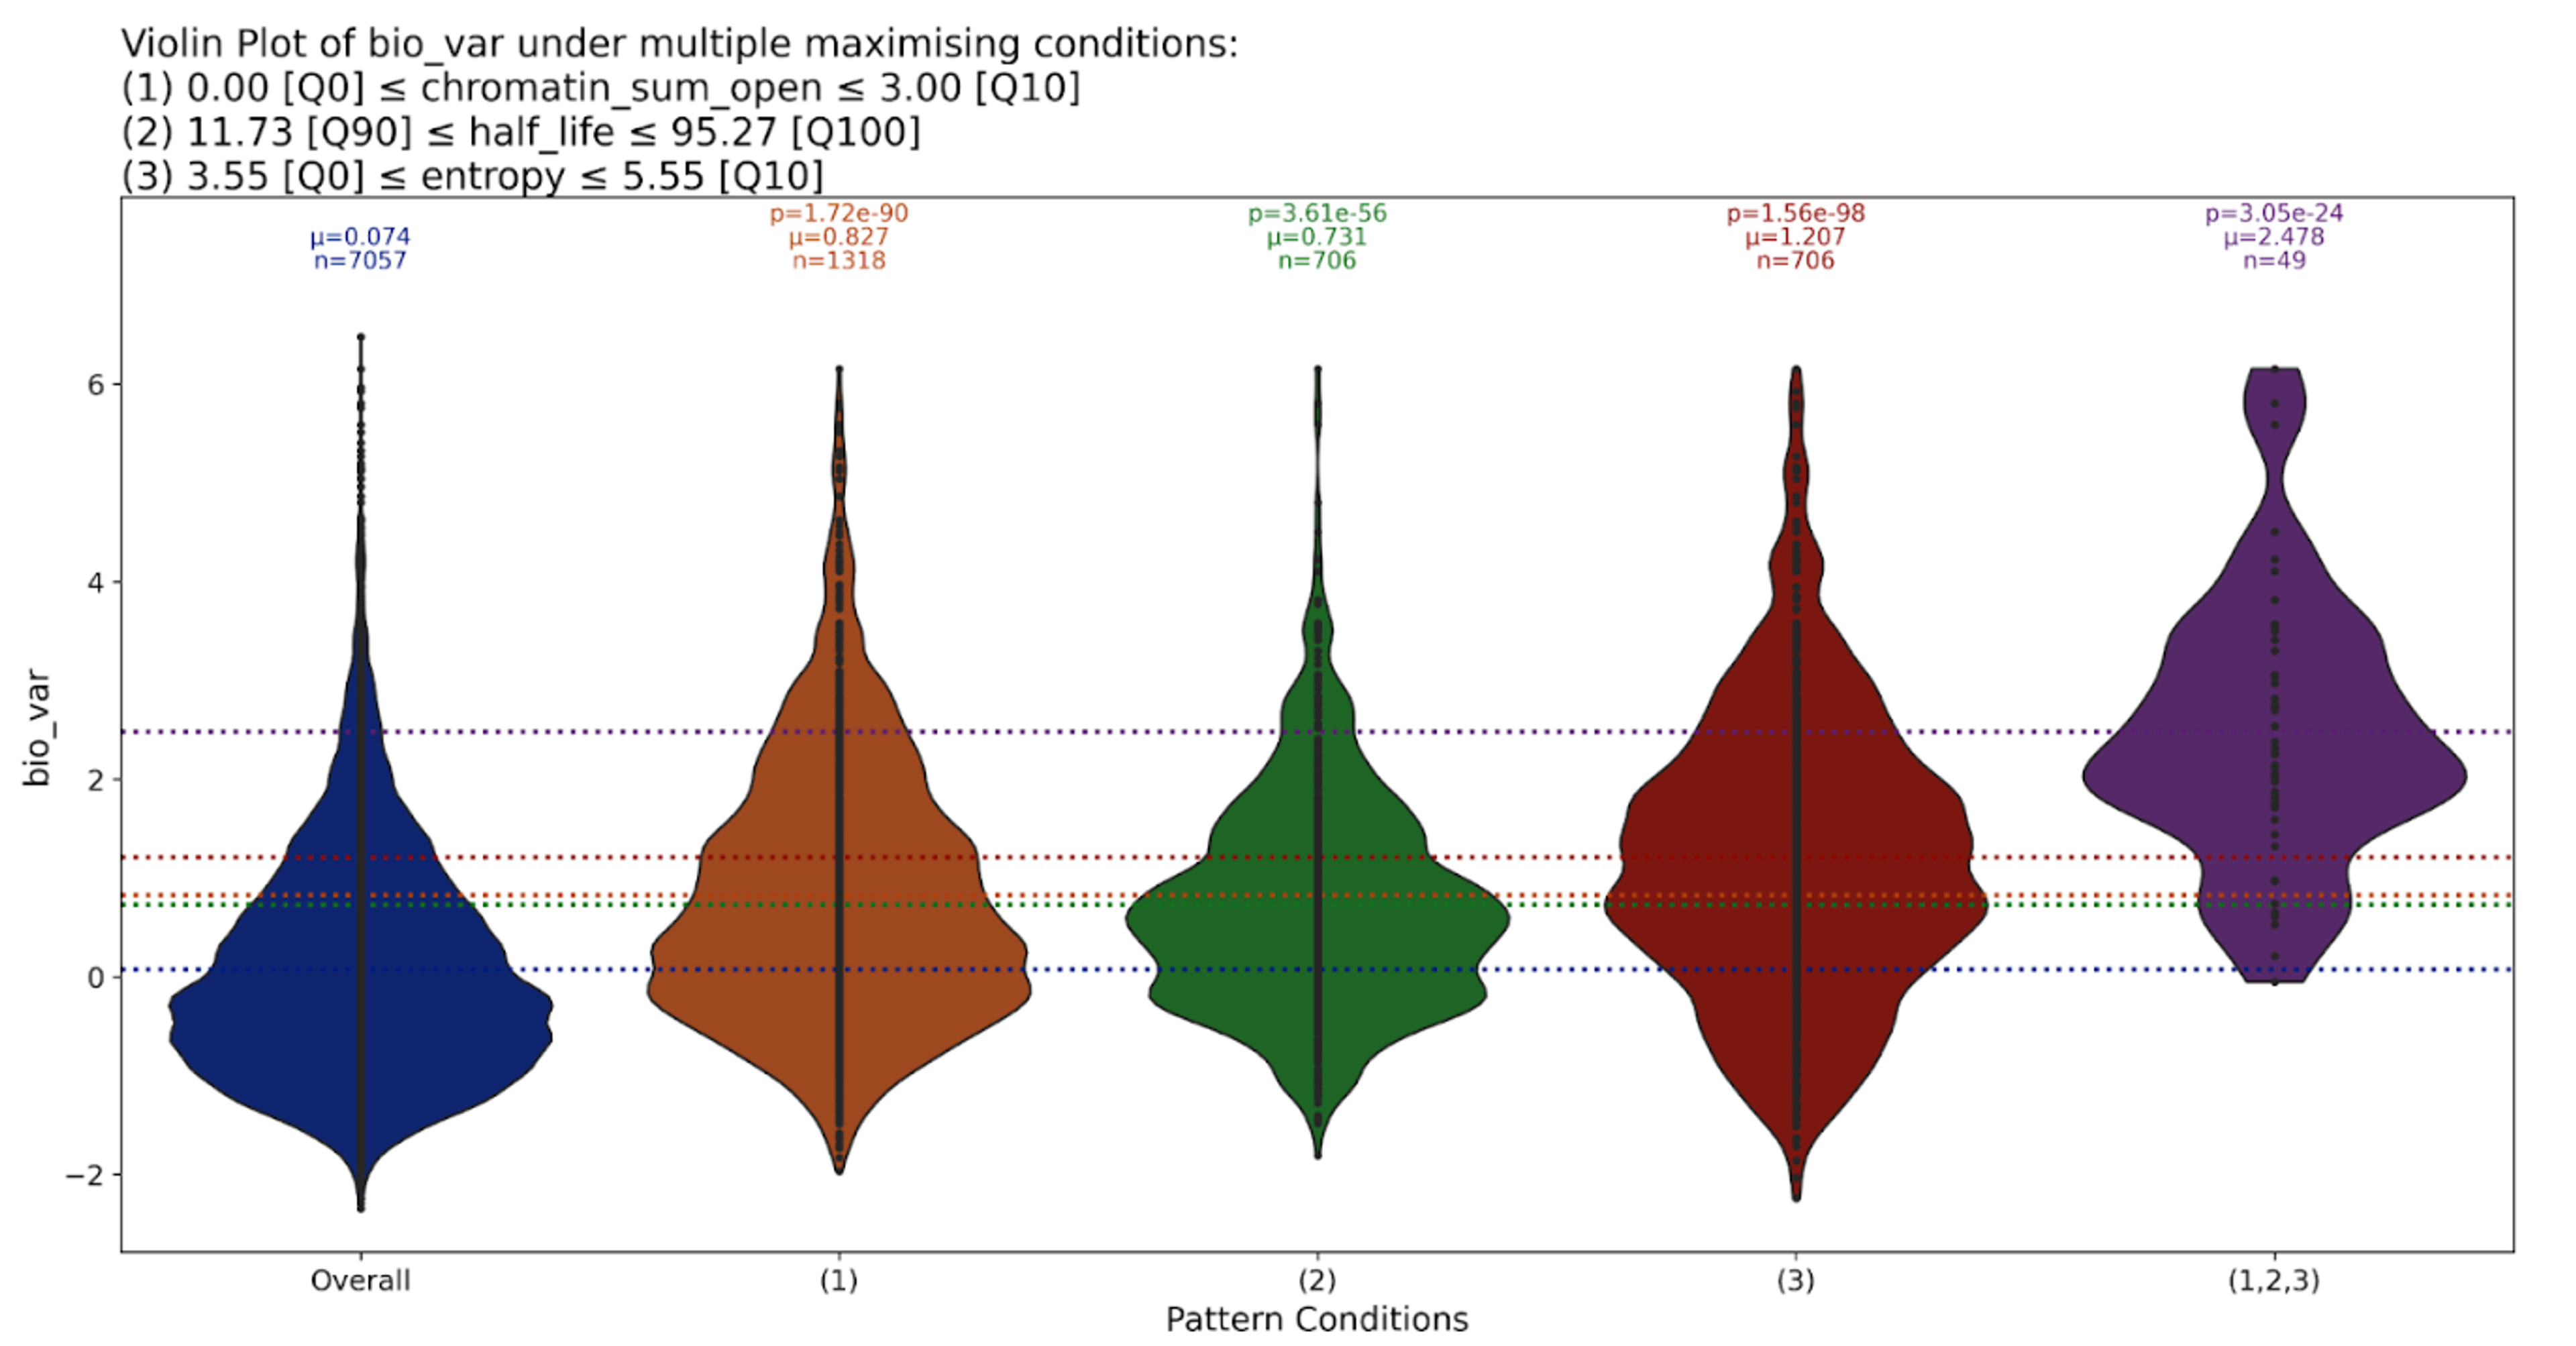
Dr Cortijo confirmed that there is no published research in plants on the direct connection between half-life and gene variance, making this a novel finding.
The closest findings within plant biology literature come from a study on mRNA decay rates from 2007, which found that transcripts with short half-lives (defined as less than 60 minutes) are associated with microRNA targeting, specific destabilizing motifs in their 3′ UTRs, and the absence of introns [5]. These results came from a dataset where mRNA half-lives varied broadly—from a few minutes to over 24 hours—reflecting substantial inter-gene differences in transcript stability. While characteristics like microRNA targeting, 3′ UTR motifs, and the lack of introns have been linked to decreased mRNA stability – which may in turn impact gene expression variability – our results uniquely and directly explore the connection between mRNA half-life and gene variability. We’ve found a previously unknown relationship here.
In addition to a long half-life maximizing gene variability, we see symmetrical patterns that show combinations of short half-life and other features minimising variability.
Future work
Excited by these results, Dr Cortijo will continue to work with Leap to investigate patterns from Discovery Engine for publication. These findings demonstrate how unbiased, data-driven discovery can illuminate hidden mechanisms in data: in this case discovering previously unknown patterns governing HVGs in plants. By automatically surfacing these kinds of unexpected connections – like the novel relationship we found between mRNA half-life and gene variability – we can go far beyond traditional hypothesis-driven research and systematically extract insight that would otherwise be overlooked.


