In collaboration with Dr. Sophie Martin from UCL, we worked with data from the Alzheimer’s Disease Neuroimaging Initiative (ADNI) to understand patterns that predict Alzheimer’s disease. Our dataset included: clinical data; demographics; cognitive scores; measurements from MRI and PET imaging; biomarkers; and diagnosis labels.
Our task was to understand what factors predicted diagnosis - distinguishing between cognitively normal individuals, those with mild cognitive impairment, and those with Alzheimer’s disease (AD) - labelled DX_bl = 0 in the data (for diagnosis at baseline). In this post we report some of the many patterns extracted autonomously by our Discovery Engine that lead to high AD risk.
Cognitive Test Scores
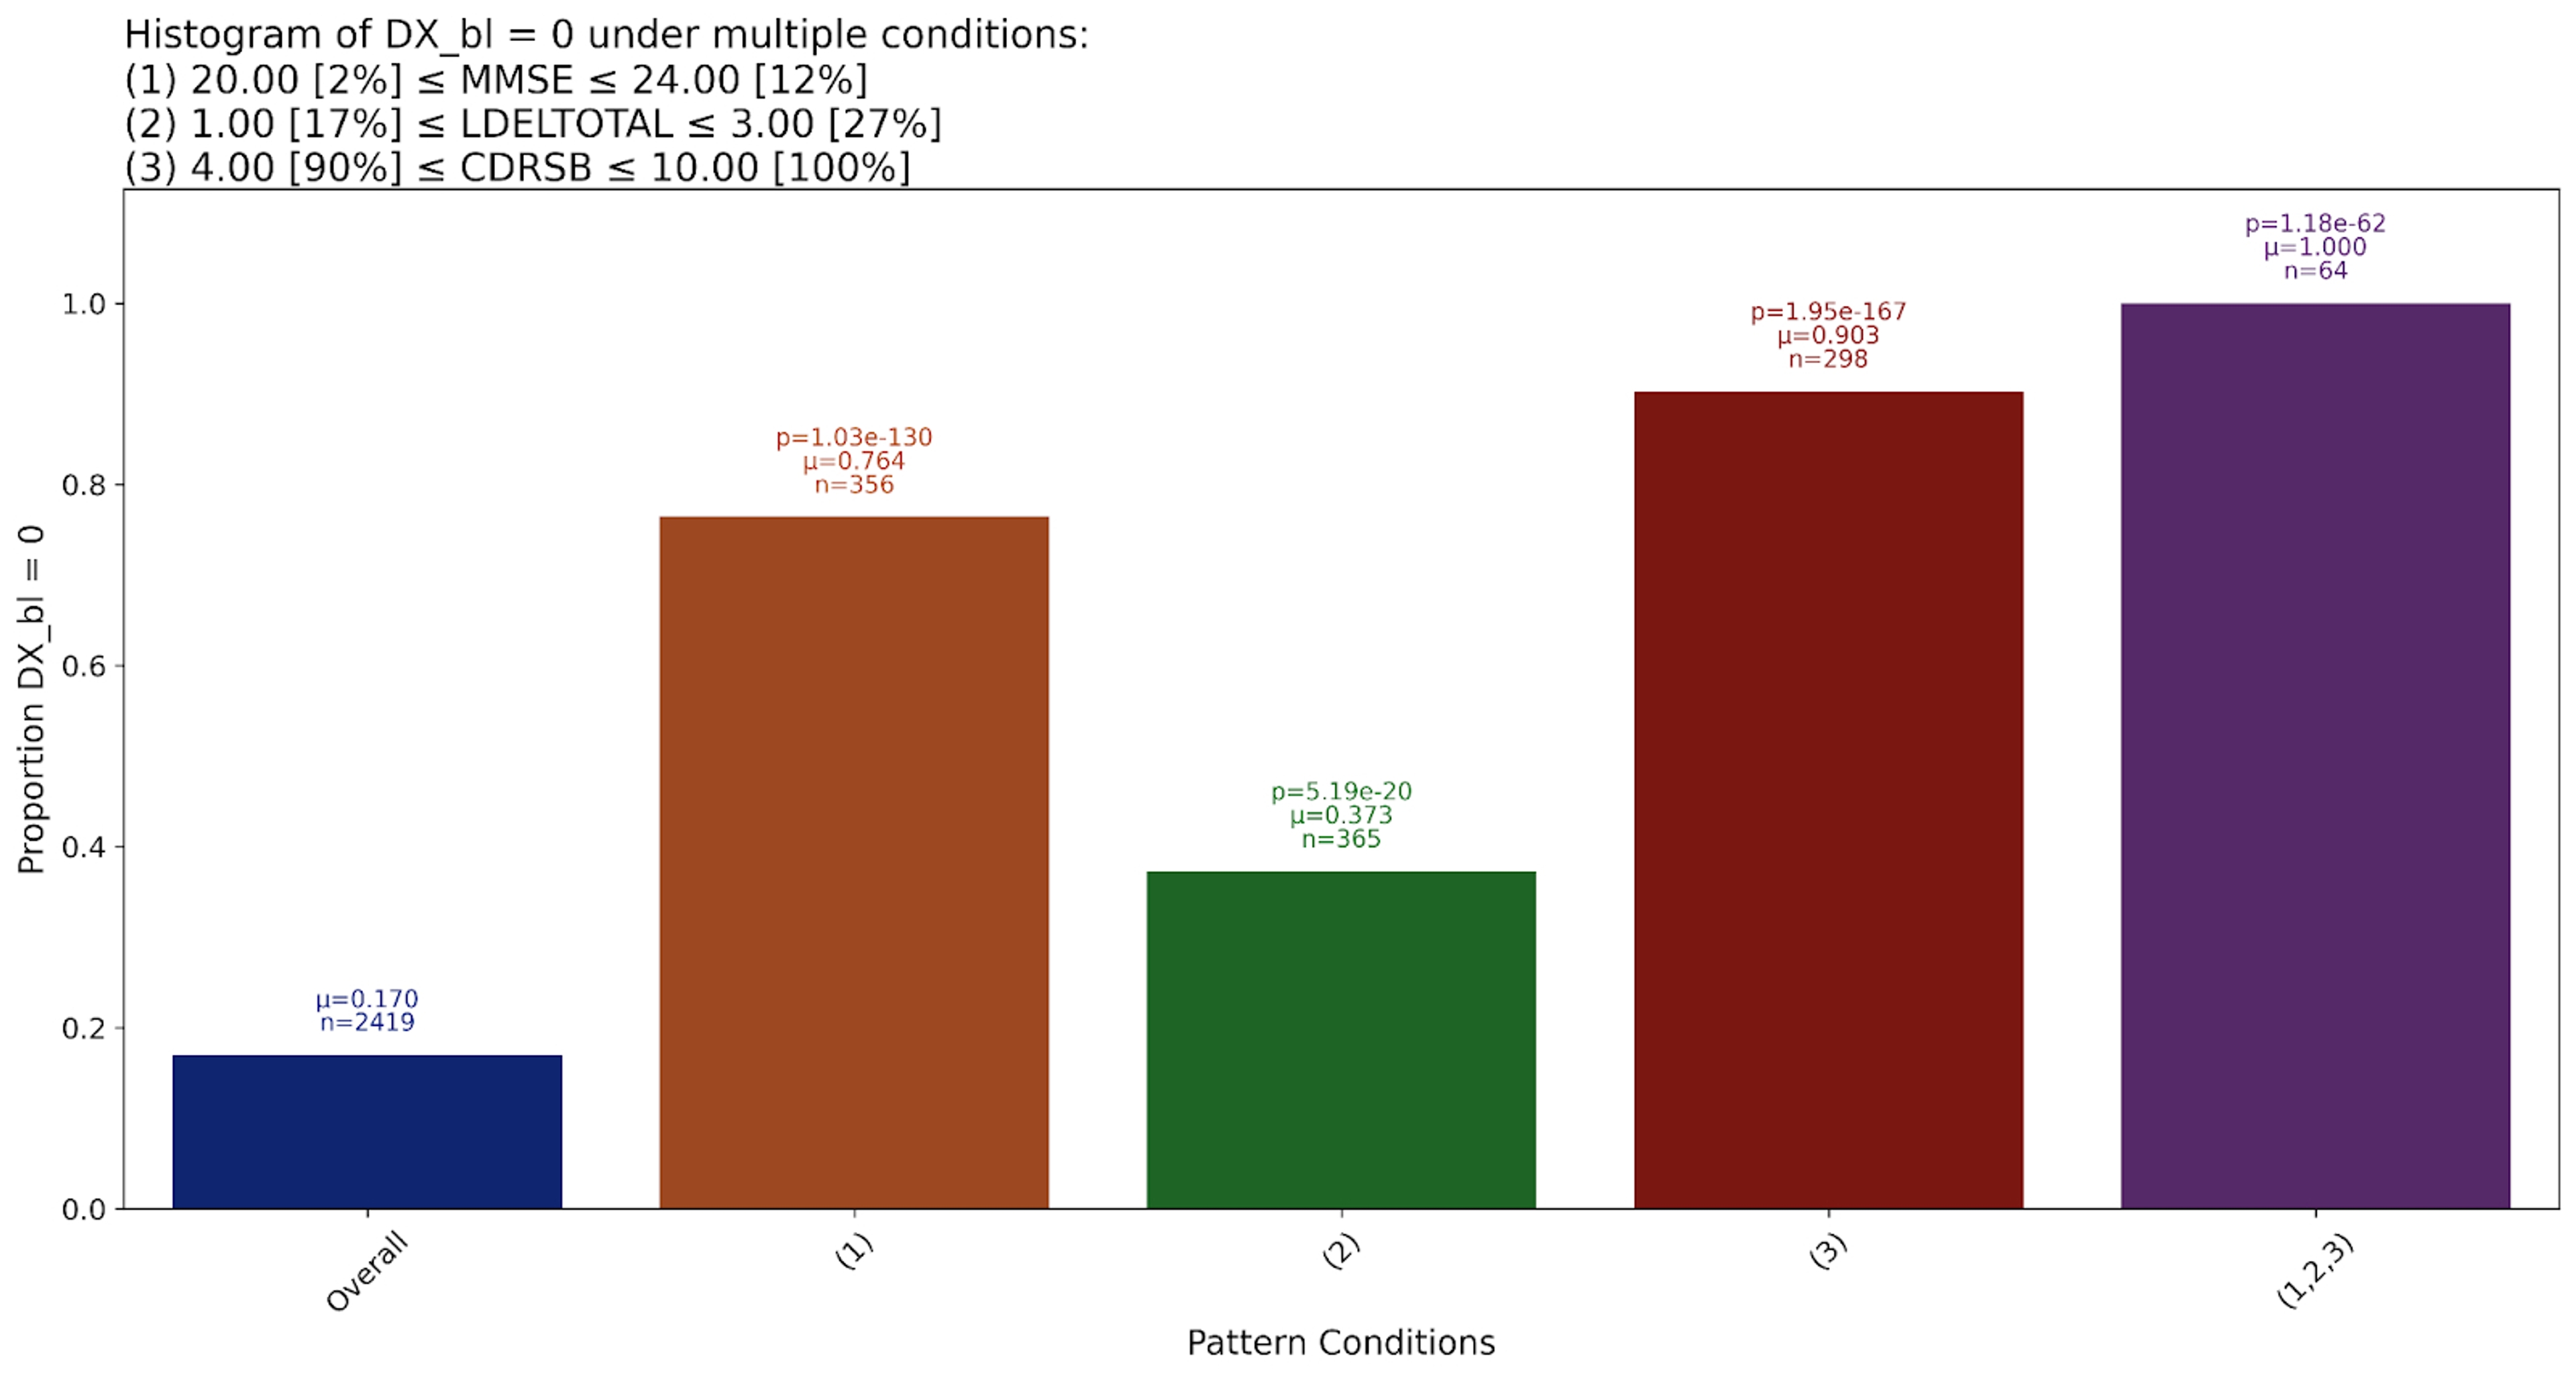
Our Discovery Engine found 30 patterns related to the AD class, all of which contain cognitive test score results in various configurations. We show just one of them below.
One way we can visualise the patterns found by Discovery Engine is through bar charts, like these. Each bar represents the proportion of the target variable (in this case, DX_bl = 0 , indicating a positive baseline diagnosis of Alzheimer’s disease) under a set of conditions, shown above the plot. The far left bar is always the proportion over the entire dataset (where n=the total number of samples). The far right bar shows the proportion filtered by the combination of conditions (i.e., the pattern). Bars in between show the effects of each condition alone.

The MMSE (Mini-Mental State Examination) is one of the most commonly used tools for screening cognitive function. It evaluates several domains, including orientation, attention, memory, language, and visual-spatial skills. Scores range from 0 to 30, with lower scores indicating greater cognitive impairment. A score below 24 is typically suggestive of possible dementia, though thresholds can vary by age and education level.
LDELTOTAL, or Logical Memory: Delayed Recall, measures a person’s ability to retain and recall narrative information after a delay. It is part of the Wechsler Memory Scale and is particularly sensitive to early memory decline, a hallmark of Alzheimer’s. Scores vary depending on the version used, but lower scores indicate poorer recall performance and are often associated with progression from mild cognitive impairment to AD.
CDR-SB (Clinical Dementia Rating - Sum of Boxes) is a clinician-rated assessment that evaluates six cognitive and functional domains: memory, orientation, judgment, community affairs, home and hobbies, and personal care. The score ranges from 0 to 18, with higher scores representing more severe dementia.
This pattern suggests that these three tests are particularly important to predict AD diagnoses, and more so if their scores belong to the extreme ends pointing to multiple aspects of cognitive decline.
This may seem trivial, but if we look closer it provides an important insight – multiple test results taken together are more predictive than any single test. This suggests that for assessment and diagnosis, while CDR-SB scores at the upper end are fairly accurate alone (indicating a ~90% chance of Alzheimer’s), we can do better by combining it with MMSE and LDELTOTAL. When all conditions are fulfilled, the probability of a positive Alzheimer’s diagnosis is 100%.
This corroborates existing findings that ensemble cognitive tests are better predictors than MMSE alone.
However, there’s a problem here – these test results are used as part of diagnostic criteria – so while their relative predictive power is interesting, of course we’d expect them to be highly predictive.
How effective are other markers at predicting Alzheimer’s diagnosis?
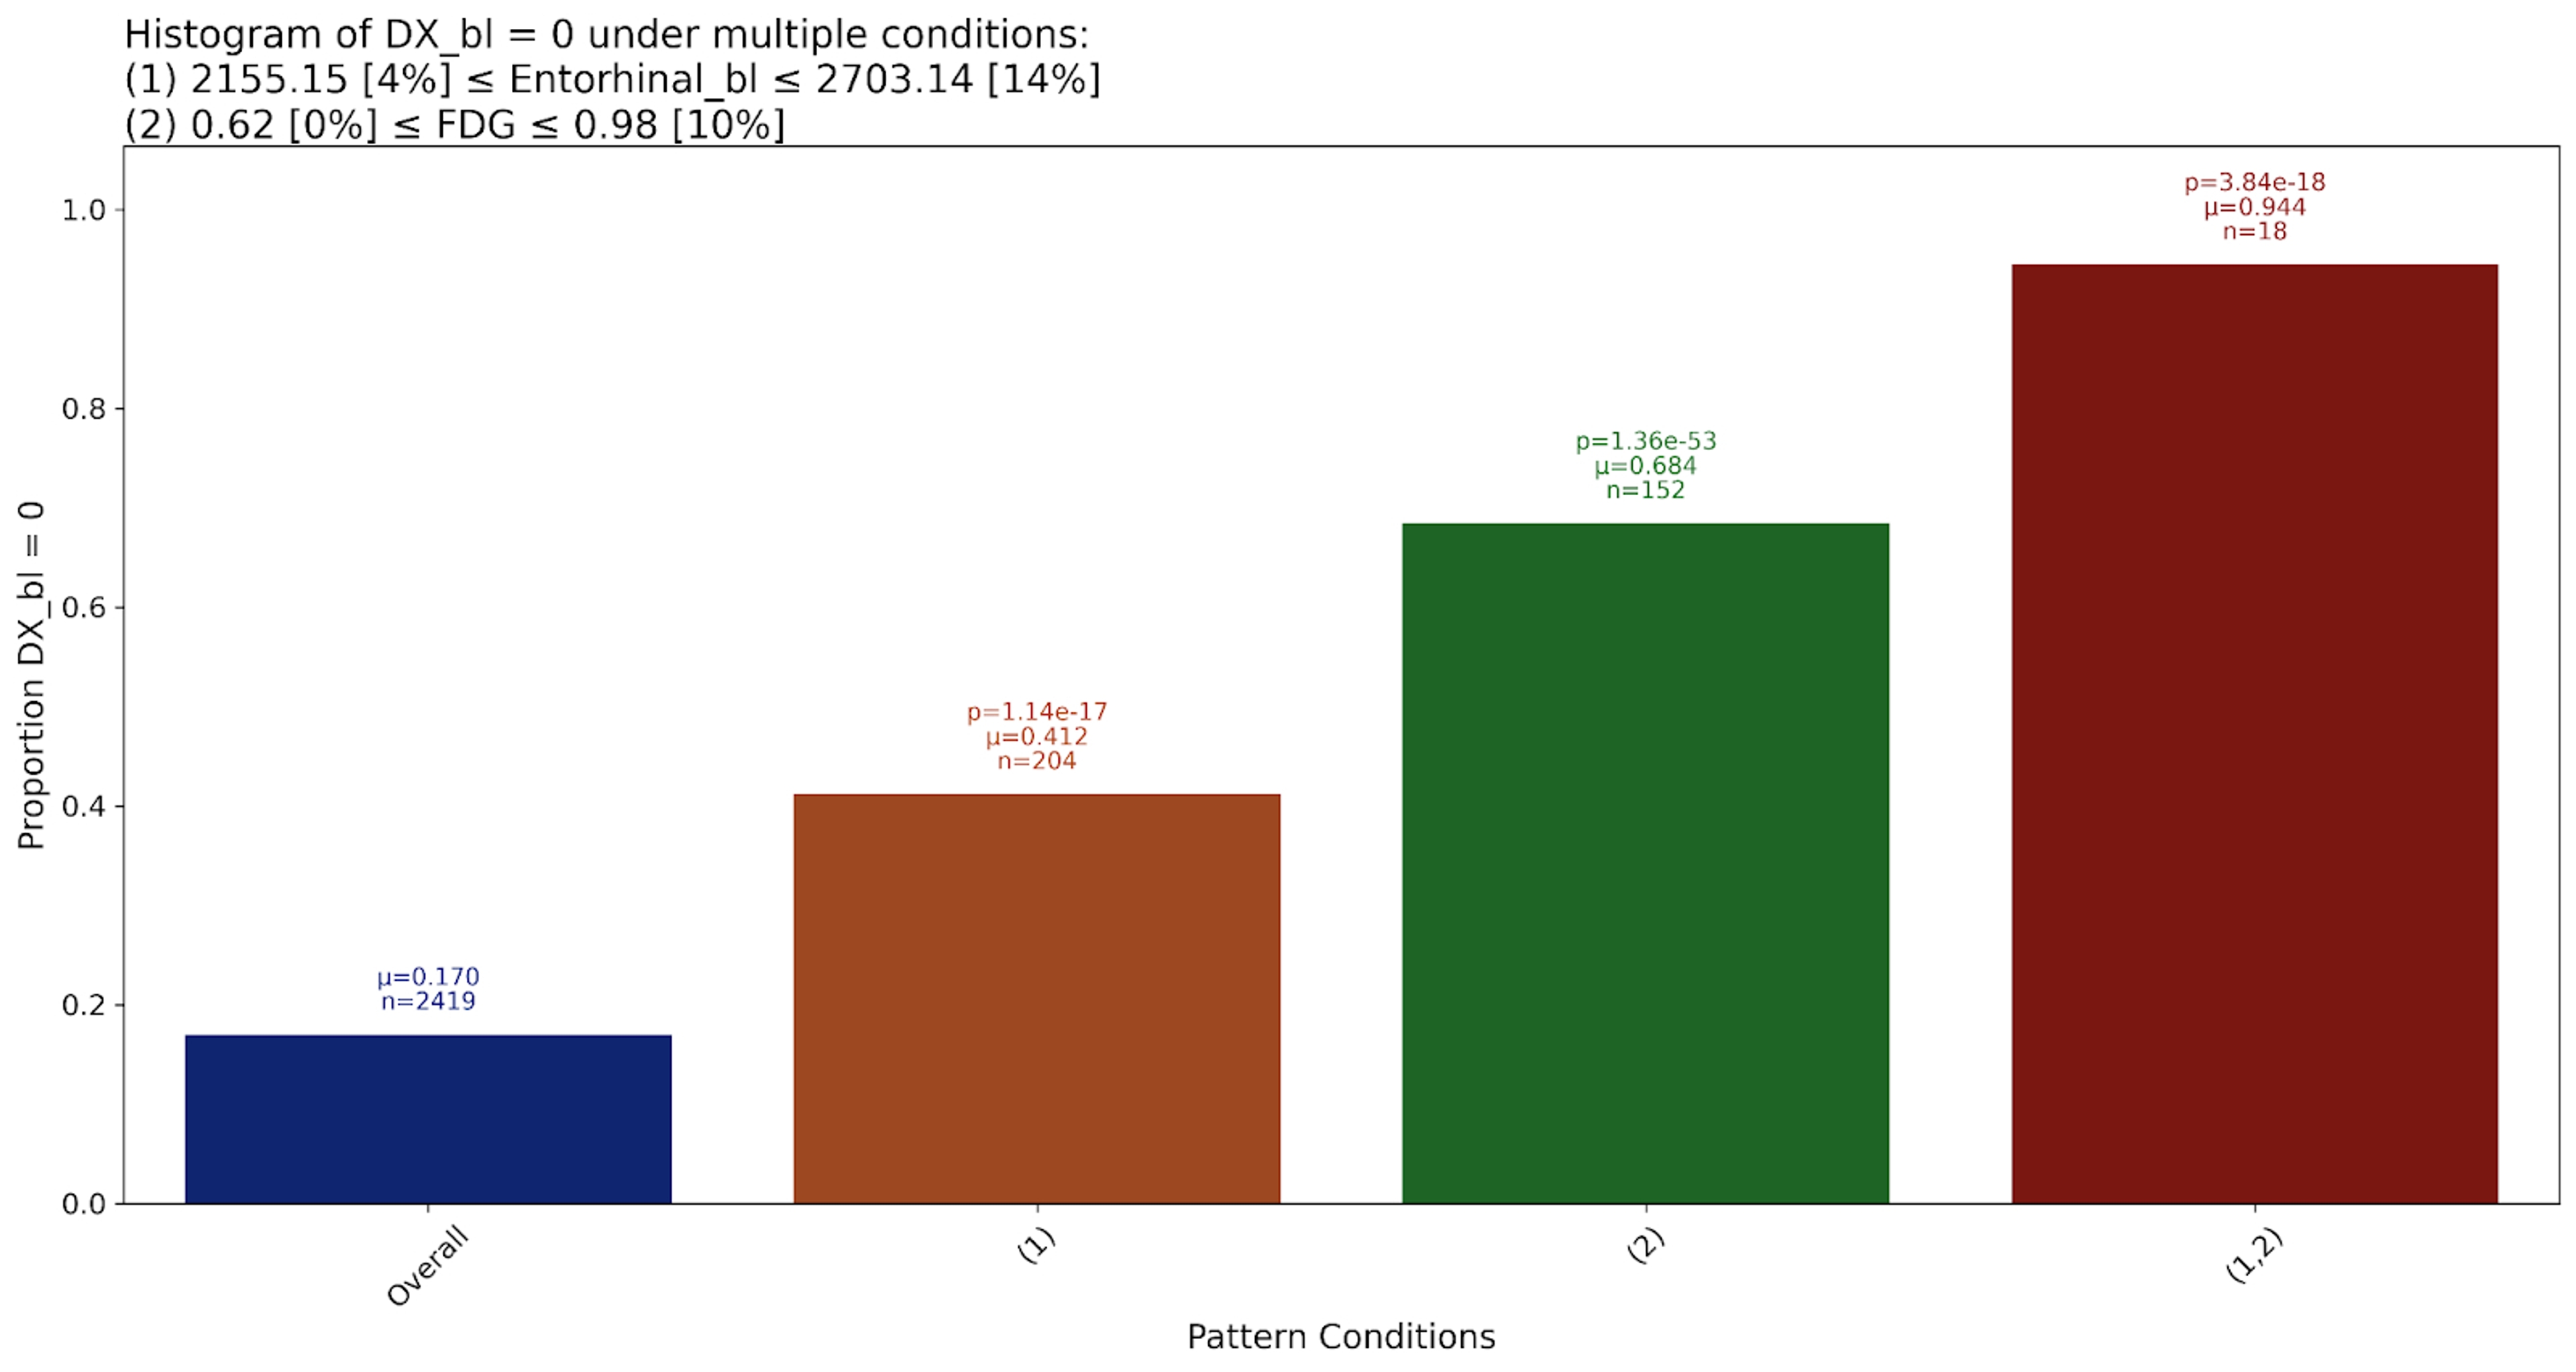
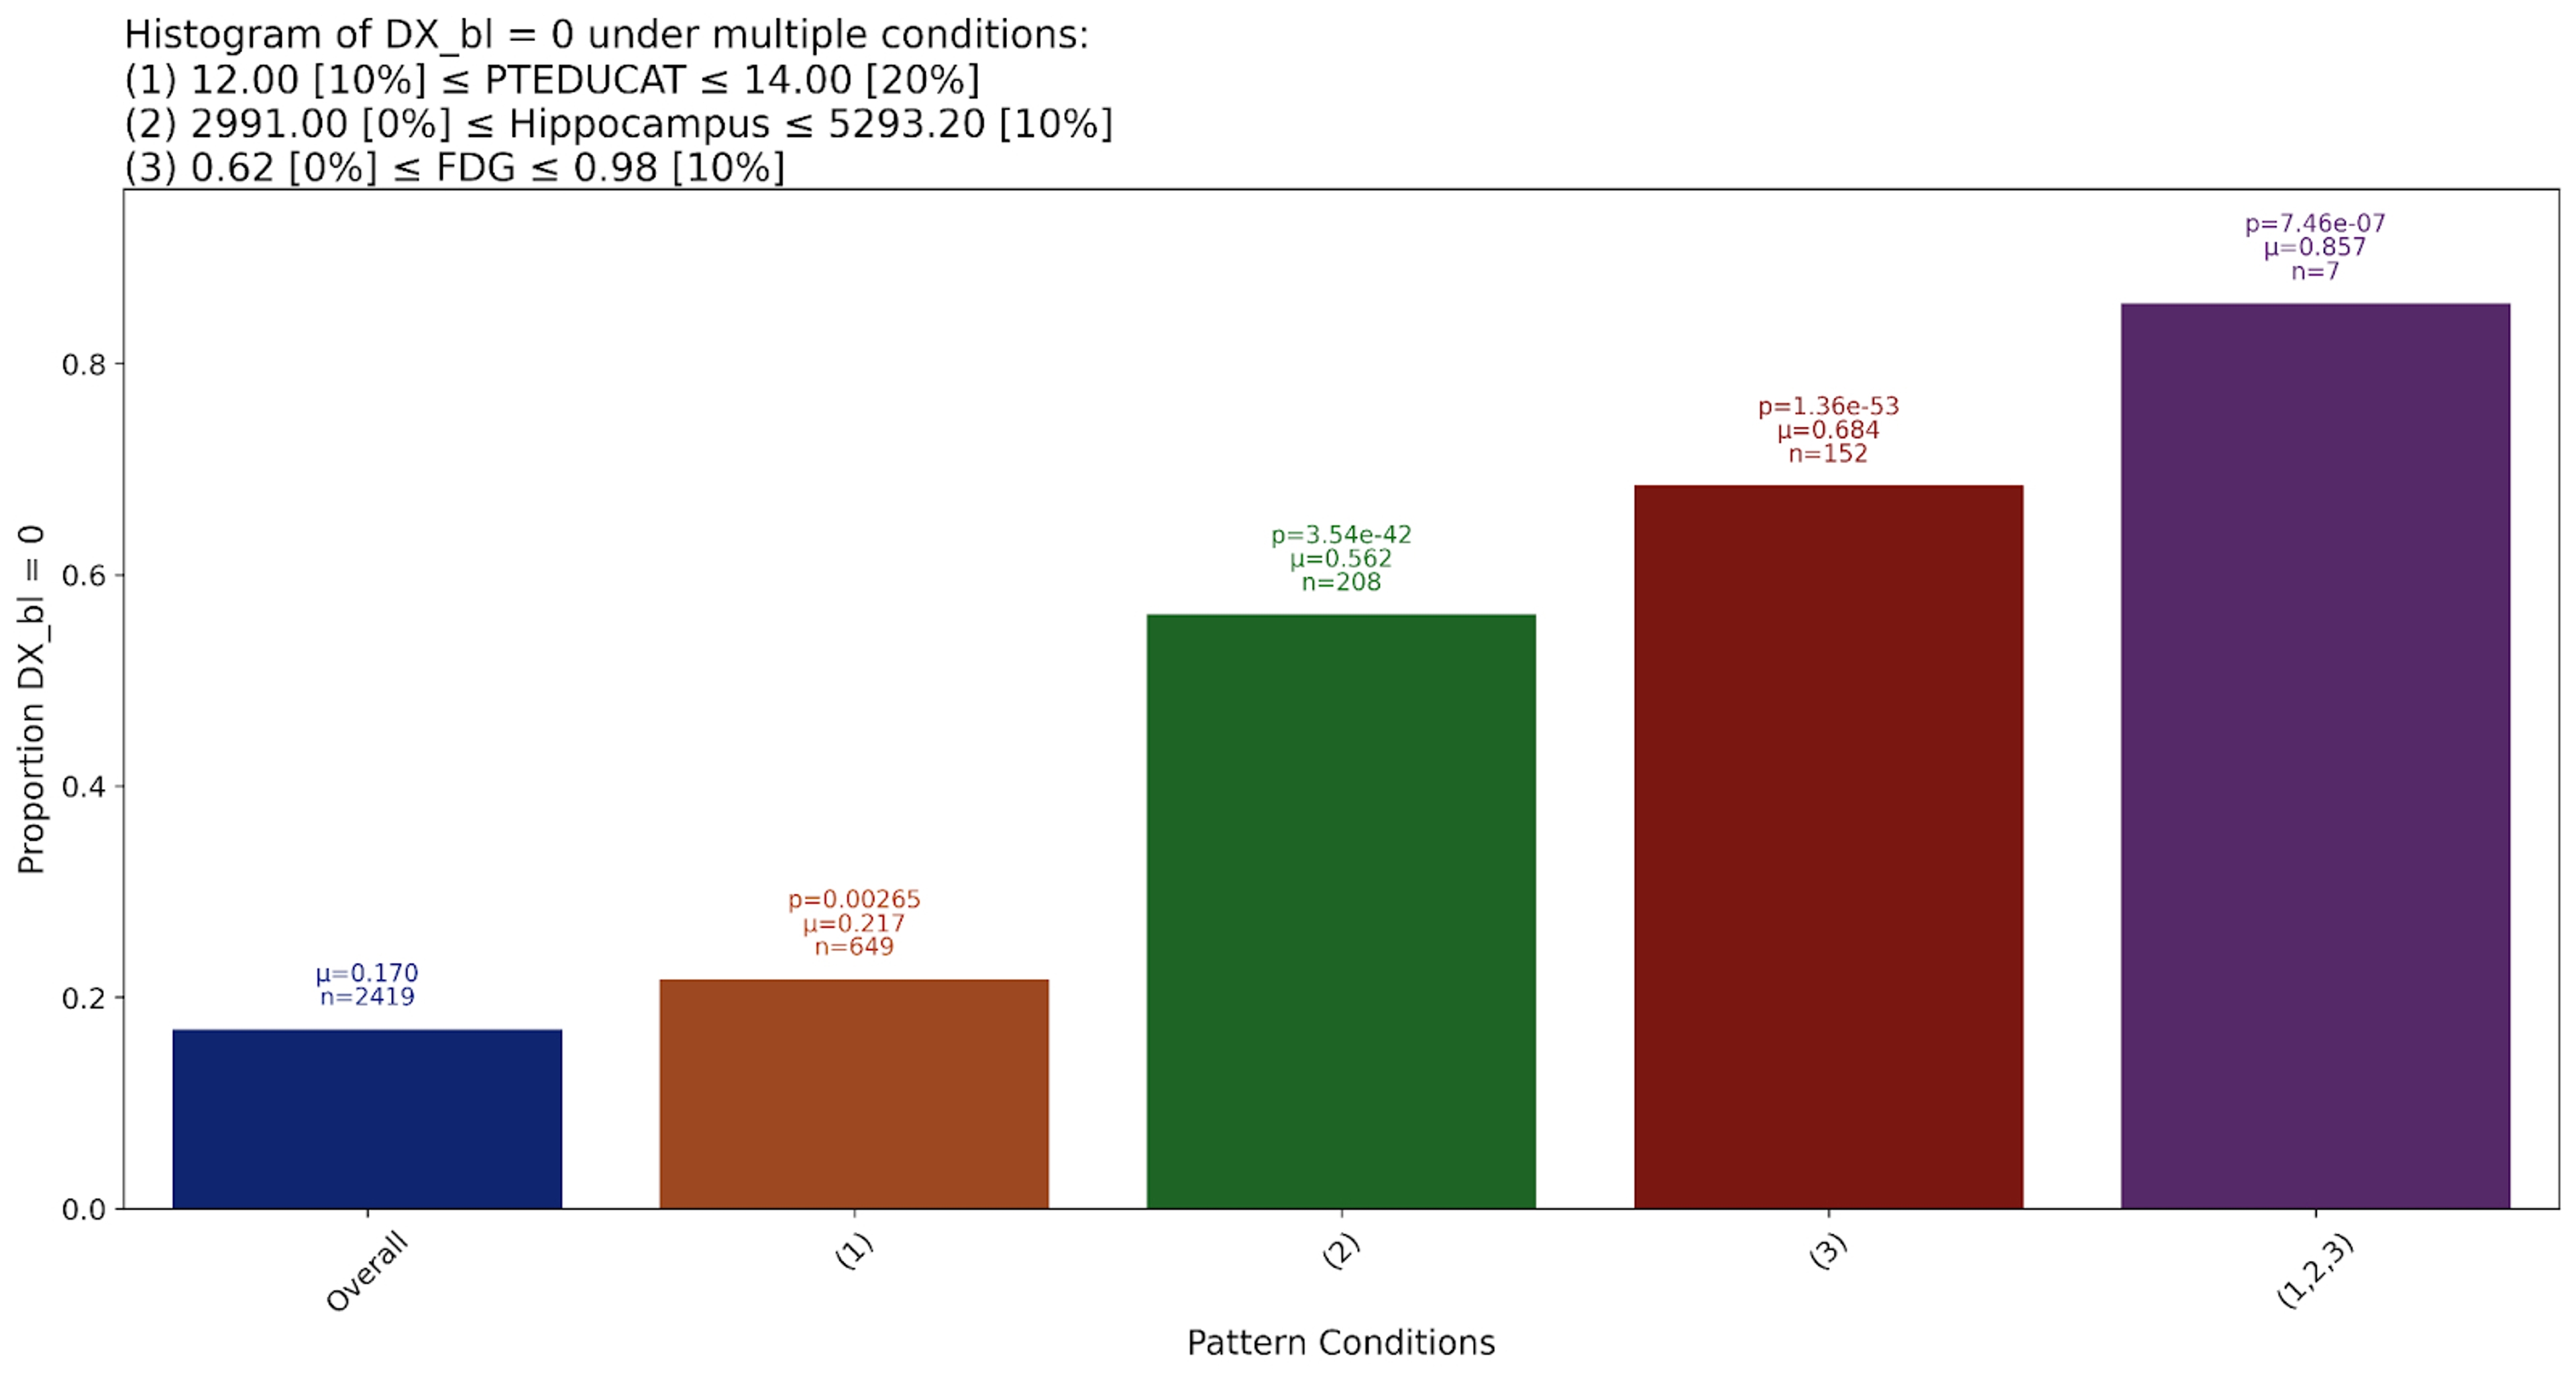
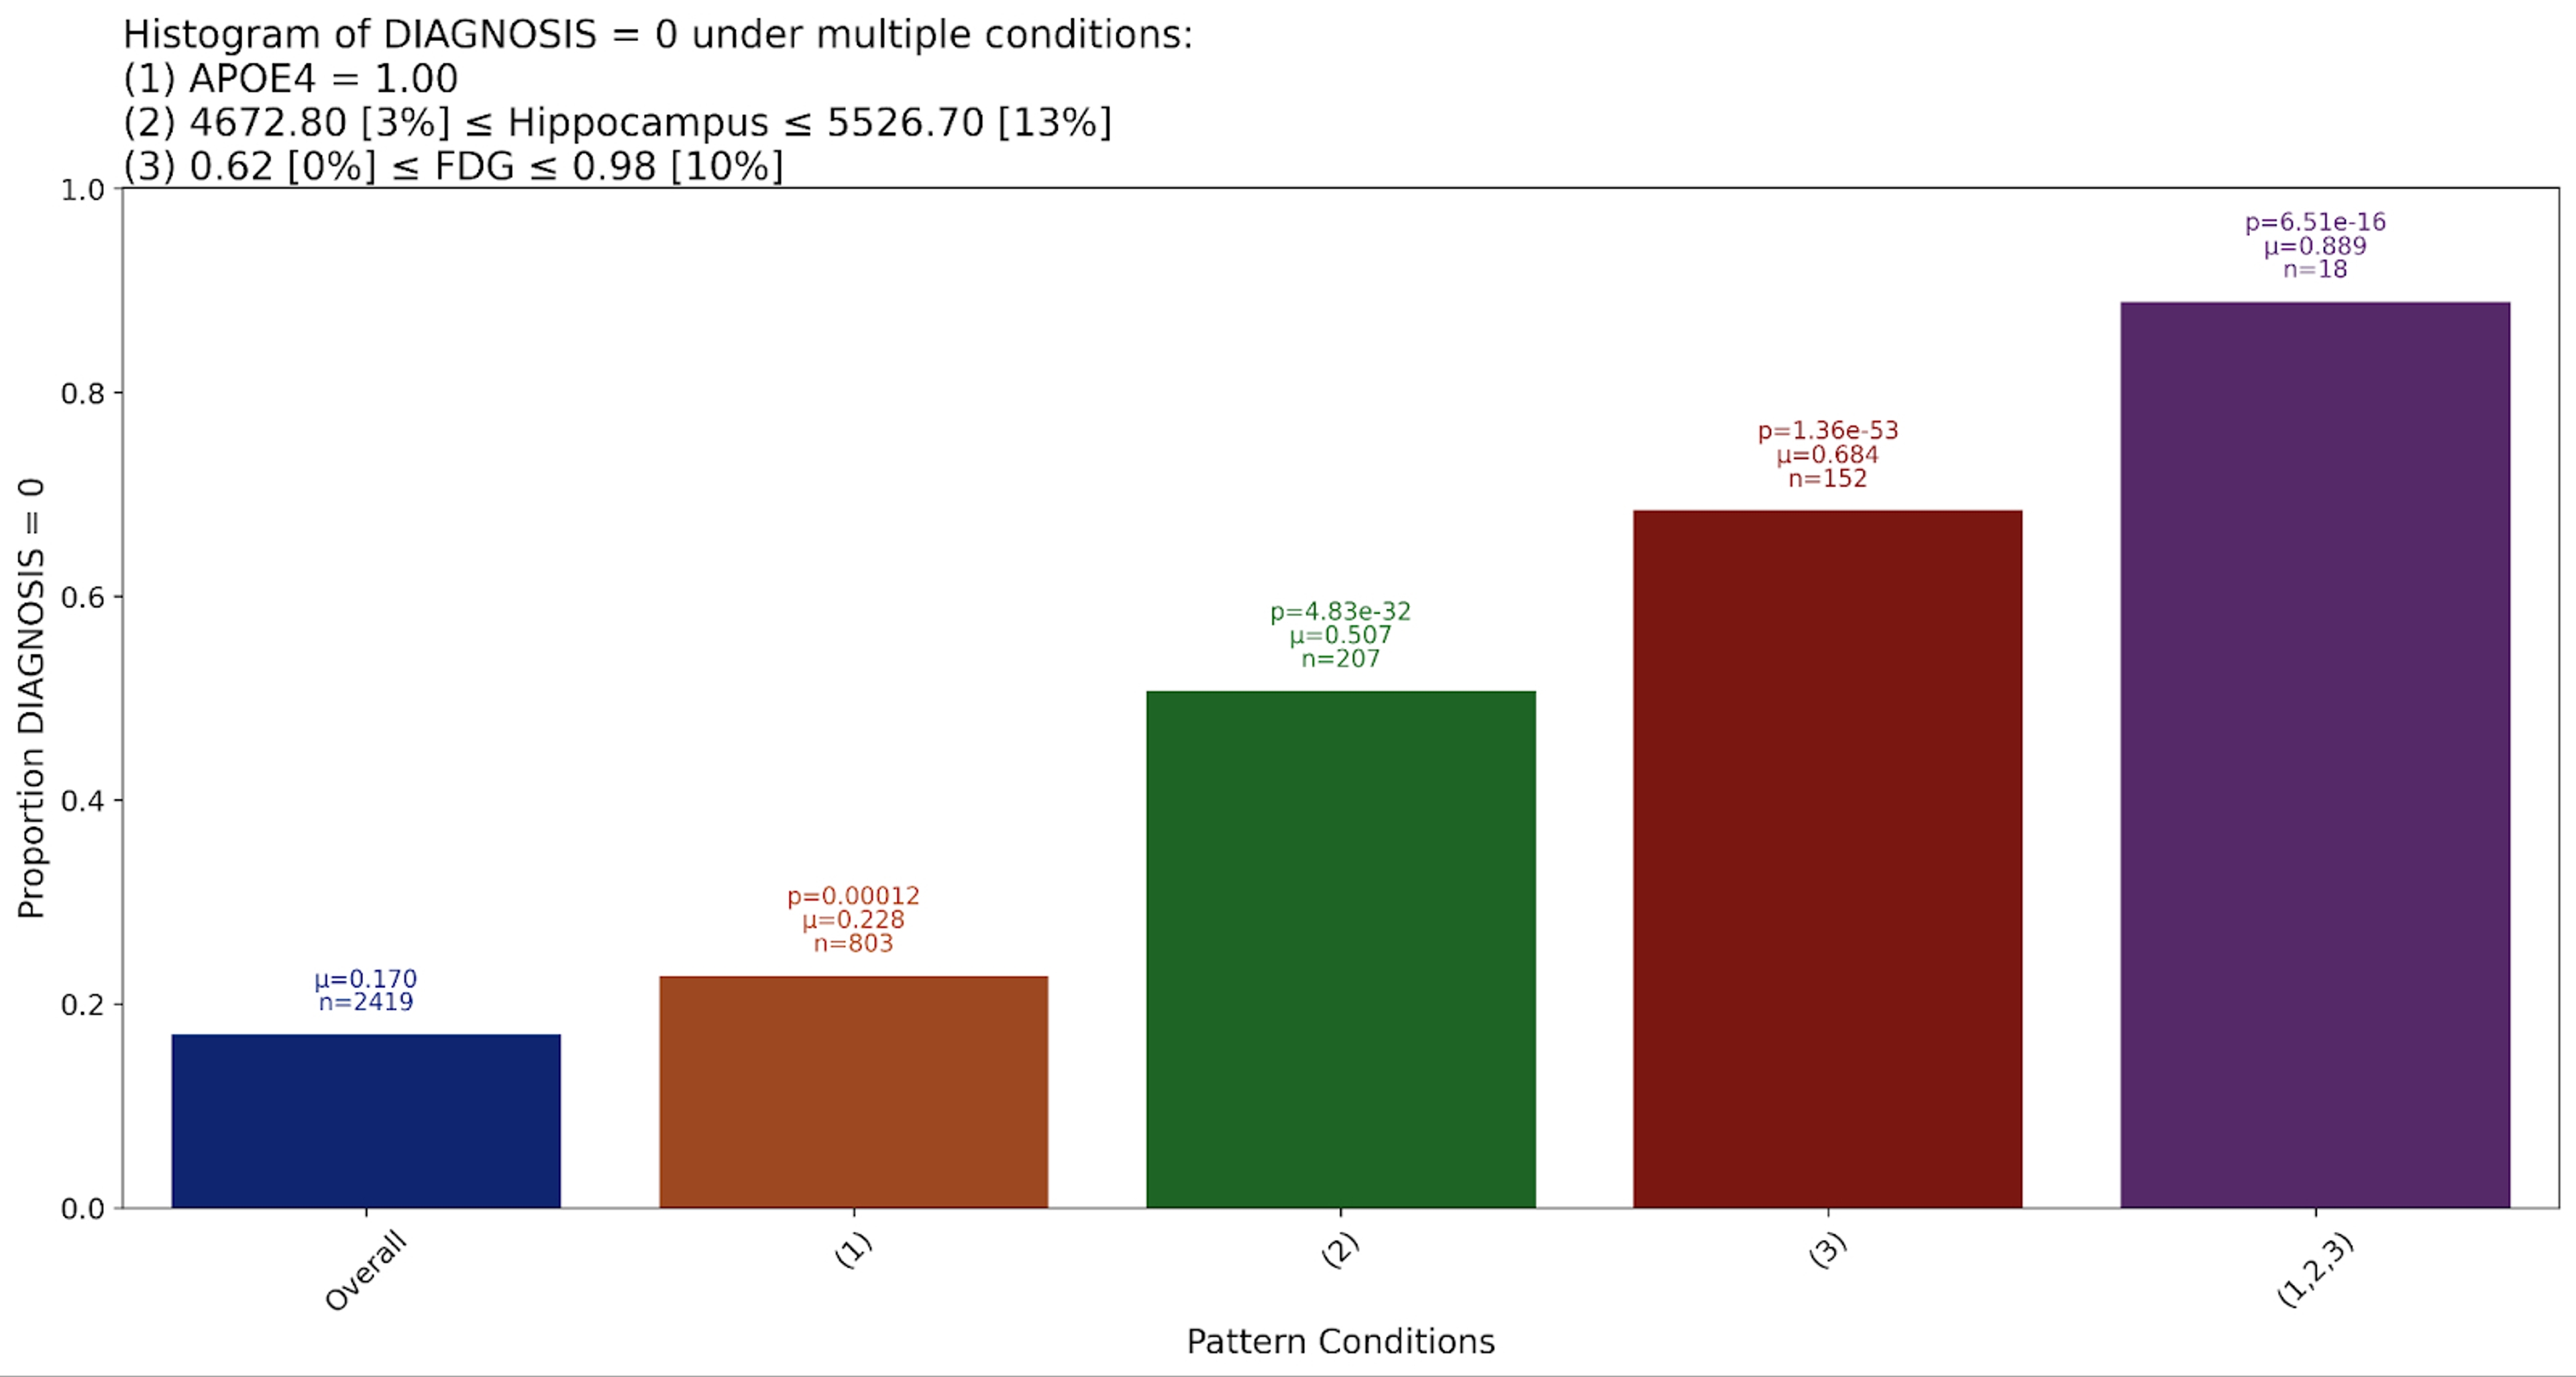
To explore this, we dropped all cognitive assessments and re-ran the data. The remaining features are a mix of MRI measurements (e.g. hippocampal volume), and other biomarkers (cerebrospinal fluid volume, presence of particular genes, etc). Discovery Engine found 23 patterns, of which we have selected the three strongest to share here.

This pattern associates low FDG readings, and low Entorhinal baseline volume, with high likelihood of Alzheimer’s diagnosis. This is well established in the literature:
The Entorhinal Cortex is a key region in the medial temporal lobe that plays a crucial role in memory and navigation. Existing work has shown that atrophy in the Entorhinal Cortex is one of the earliest structural changes detectable in individuals at risk for Alzheimer’s disease. Because it connects directly to the hippocampus, degradation in this region is strongly linked to episodic memory loss and progression to clinical Alzheimer’s.
FDG refers to the FDG-PET meta-ROI which is defined as the voxel-number weighted average of the median uptake in the angular gyrus, posterior cingulate, and inferior temporal cortical ROIs and normalized to the pons and vermis median. It is also established that patients with a median FDG-PET reading of 1.21 suffer from cognitive impairment.

This pattern replicates two established predictors of Alzheimer’s: Hippocampal volume and education level. Hippocampal atrophy is one of the most consistently observed structural changes, and the relationship between it and Alzheimer’s risk has been extensively studied, evidencing a strong relationship: as hippocampal volume decreases, the likelihood of an Alzheimer’s diagnosis increases.
Education level (PTEDUCAT) has long been recognized as a potential protective factor against cognitive decline, often interpreted through the lens of cognitive reserve theory. Gatz et al. reported a higher incidence of Alzheimer’s among individuals with lower levels of formal education, suggesting that education may buffer against early symptoms or delay diagnosis through enhanced neural compensation.

Genetic risk factors play a crucial role in the development of Alzheimer’s disease, with the APOE gene being one of the most studied. Strittmatter et al. were among the first to establish that the E4 allele of the APOE gene significantly increases the risk of developing Alzheimer’s. Individuals carrying one or two copies of the APOE ε4 variant are at a much higher risk, and often experience earlier onset of symptoms.
Our system confirms this well-documented relationship. The presence of the APOE4 (Number of APOE ε4 alleles) emerged as a strong predictor, confirming its status as a major genetic marker for AD.
A Scientist’s Perspective
This work was conducted in collaboration with Dr. Sophie Martin, a Research Fellow at the Hawkes Institute at UCL. On this dataset, Discovery Engine primarily confirmed information already established in the literature. This is a useful benchmark for us – we can demonstrate that Discovery Engine is reliable, and build trust in future novel insights.
“These patterns are well-known so it’s not surprising that your system finds them, but it’s useful to see them laid out in this way, to validate them against existing knowledge and inform future research directions.”
— Dr. Sophie Martin
Looking ahead, we plan to move beyond these broad diagnostic markers. Our next focus is on understanding less well established relationships, working with more granular data. Dr Martin hopes to use Discovery Engine to answer more subtle questions – such as why some patients progress rapidly while others do not – and to extract insights that support personalised and subtype-specific risk modeling.


